

Let me emphasize at the outset – yes, in PFMEA we can bring about a change in (SEV), the indicator that shows the severity of the effects of a failure mode for customers. But before about how this is possible a brief introduction is necessary.
Introduction
PFMEA analysis captures all errors that may occur in the process (usually related to failure to achieve the intended value of a given product characteristic – e.g. tube too long, hole diameter too small, label stuck outside the designated field) and then forces an assessment of how important (severe) it is for customers. This severity is standardly described on a scale of 1-10, where 1 means an imperceptible effect for the customer and 10 means a very serious effect (e.g. related to customer safety). Very important in the context of this study is that for each defect in the full risk analysis the effects are assessed from the perspective of at least three customers:
- I – internal customer for example an employee from the next workplace.
- E – external customer who will process rework use our product in some way e.g. as a component of his product.
- U – user customer, who will ultimately use the product so this is the first customer who directly cares about the functionality (especially long-term) of the product.
In the PFMEA analysis of course it is impossible to influence the effects on customer U – for they flow from the design and expected functionality of the product (and therefore directly follow from the DFMEA analysis). It is also difficult to change the significance of a defect for customer E – although this is possible in specific cases but this is a topic for a separate study. However it is possible during the process analysis in specific situations to lower the effects (SEV indicator) for internal customer [I]. To understand this well you need to know the SEV scale for this customer. Figure 1 shows an excerpt from the SEV table for PFMEA analysis jointly developed by the AIAG and VDA organizations.
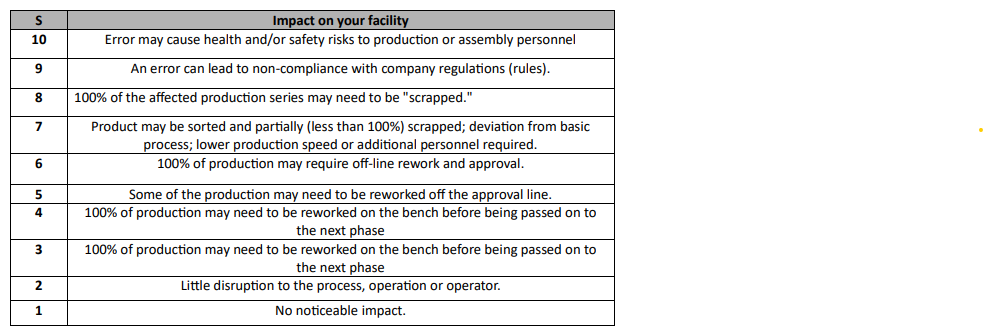
Fig. 1. Table for assessing the severity from the internal customer’s point of view.
Source: FMEA handbook, AIAG & VDA ed. 1, 2019.
Example
So let’s imagine the following process – figure 2.
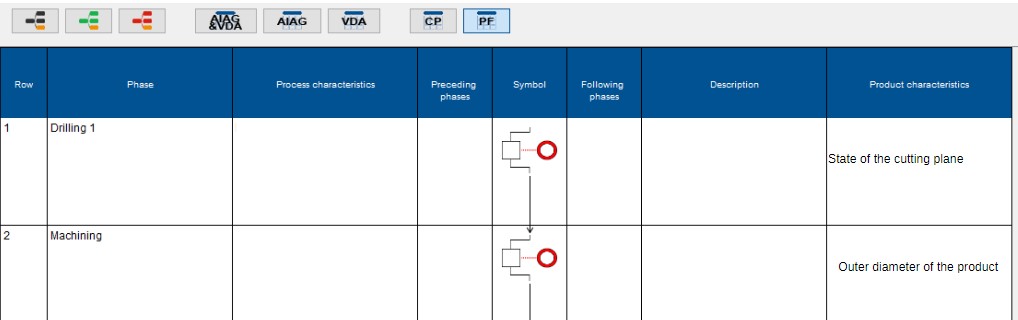
Fig. 2. Example of the process flow – fragment
Source: own development (PQ-FMEA program)
Let’s assume that in the cutting phase one of the defects is the resulting sharp edge (sharp burr) on the cut plane caused by the blunt saw (the “Cutting” phase) and resulting in possible injury to the operator (according to the SEV=10 table) who takes the cut parts by hand from the container and mounts them to the chuck in the lathe (Figure 3).

Fig. 3. Example structure of 2,3 and 4 step (PQ-FMEA+ software)
Source: own development (PQ-FMEA software).
Clearly no actions implemented at the cutting stage will affect the SEV – because for example the introduction of a sharpening or saw replacement standard will at most change the OCC value showing the incidence of the failure cause. Also the introduction of 100-percent control in the cutting phase does not change the SEV because as a rule this control will not be taken into account when assessing the severity level. Thus, from the “Cutting” phase level the task of reduce SEV is impossible. But… the task is already possible from a broader point of view – here from the point of view of the “Machining” phase. If we change the course of the process a bit and introduce the standard of interleaving and mounting of cut parts with special pliers – the situation changes significantly. Now the sharp edge of the product after cutting will no longer cause injury to the worker. A possible consequence of this error will now be for example faster tool wear in the lathe. The situation will therefore be as shown in Figure 4.
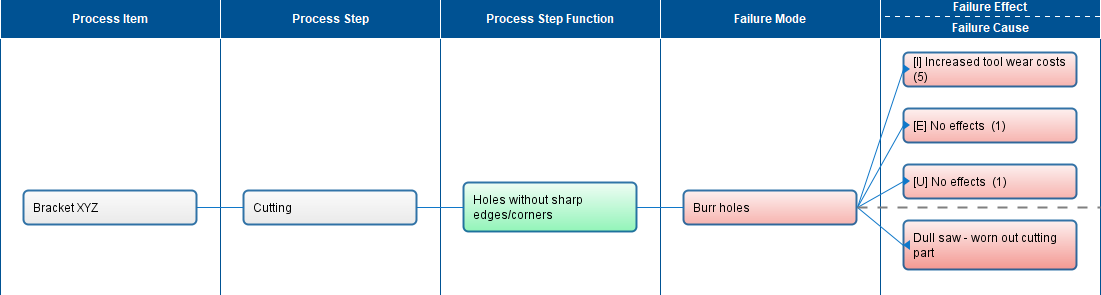
Figure 4: Example structure of steps 2, 3 and 4 (PQ-FMEA+ program)
Source: own development (PQ-FMEA program).
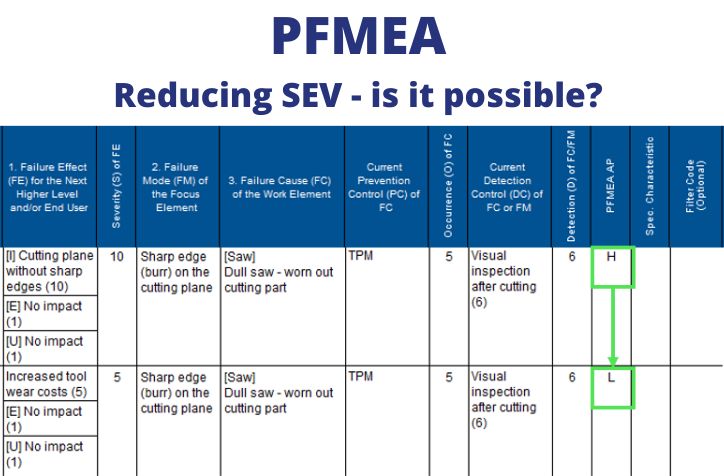
Formally therefore changing the course of the process cannot be considered a preventive action in the cutting phase because according to the logic of PFMEA prevention is an action to reduce the occurrence of the cause of the error. In the case described here nothing was done to reduce the incidence of blunt sawing. However a clear change can be seen in the risk assessment results (Figure 5).
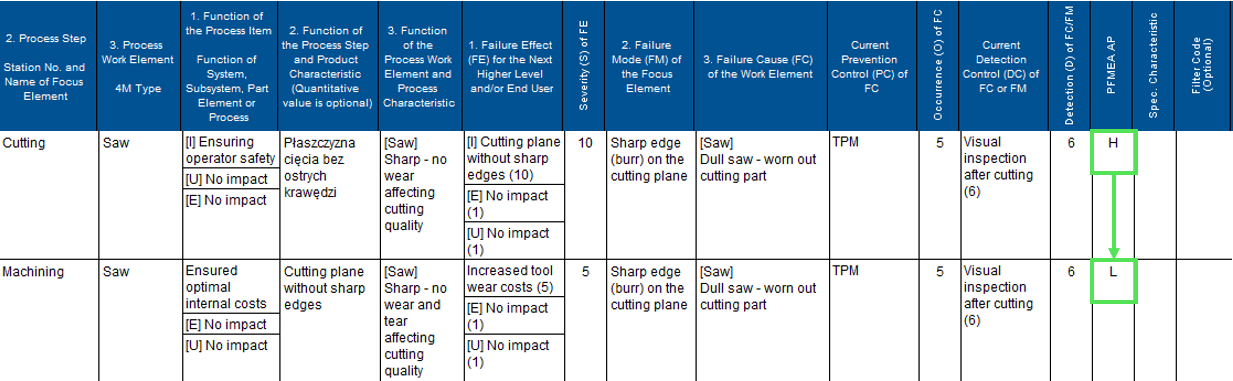
Fig. 5. PFMEA risk analysis results before and after a change in the process flow (PQ-FMEA+ program).
Source: own development (PQ-FMEA program).
Figure 5 shows the form and evaluation according to the AIAG & VDA standard but an analogous improvement will be obtained when working with previous standards for PFMEA analysis and aftermath using the RPN indicator.
Summary
What is obvious is that the example presented in this paper is quite simple (even trivial) but it may become “inspiration” to look for other more sophisticated ways to improve the processes under analysis other than the now notorious “operator training.”
Leave A Comment
You must be logged in to post a comment.